Most subcontractors find out whether a site made money when it's finished. The accountant's monthly P&L shows the business is profitable, so it must be fine. Then the year-end figures come in lower than expected, and nobody can say which site, house type or stage caused it.
Plot-level P&L fixes that by putting cost and value side by side, per plot, while the work is still going on.
What does plot-level P&L show?
| Measure | What it is | Where it comes from |
|---|---|---|
| Base cost | What the plot should cost from your price build-up | House type materials and labour |
| Current cost | What it is costing so far | Approved work submissions, orders and consumables |
| Variation cost | Cost of changes on this plot | Variations |
| Total cost | Current plus variations | Calculated |
| Sales | What you'll be paid | Contract stages, variations, sales extras |
| Margin | Sales less total cost | Calculated |
When current cost runs ahead of base cost on the same house type across several plots, the price or the method is wrong, and you've found out at plot 10 rather than plot 60.
Why does the house type matter so much?
On a housing site you price each house type once and build it many times. A small error repeats on every plot of that type. Comparing the same house type across plots tells you whether:
- the price is too low for that design,
- one gang is slower or more wasteful than another,
- materials are being over-ordered or lost, or
- variations on that type aren't being claimed.
A worked example
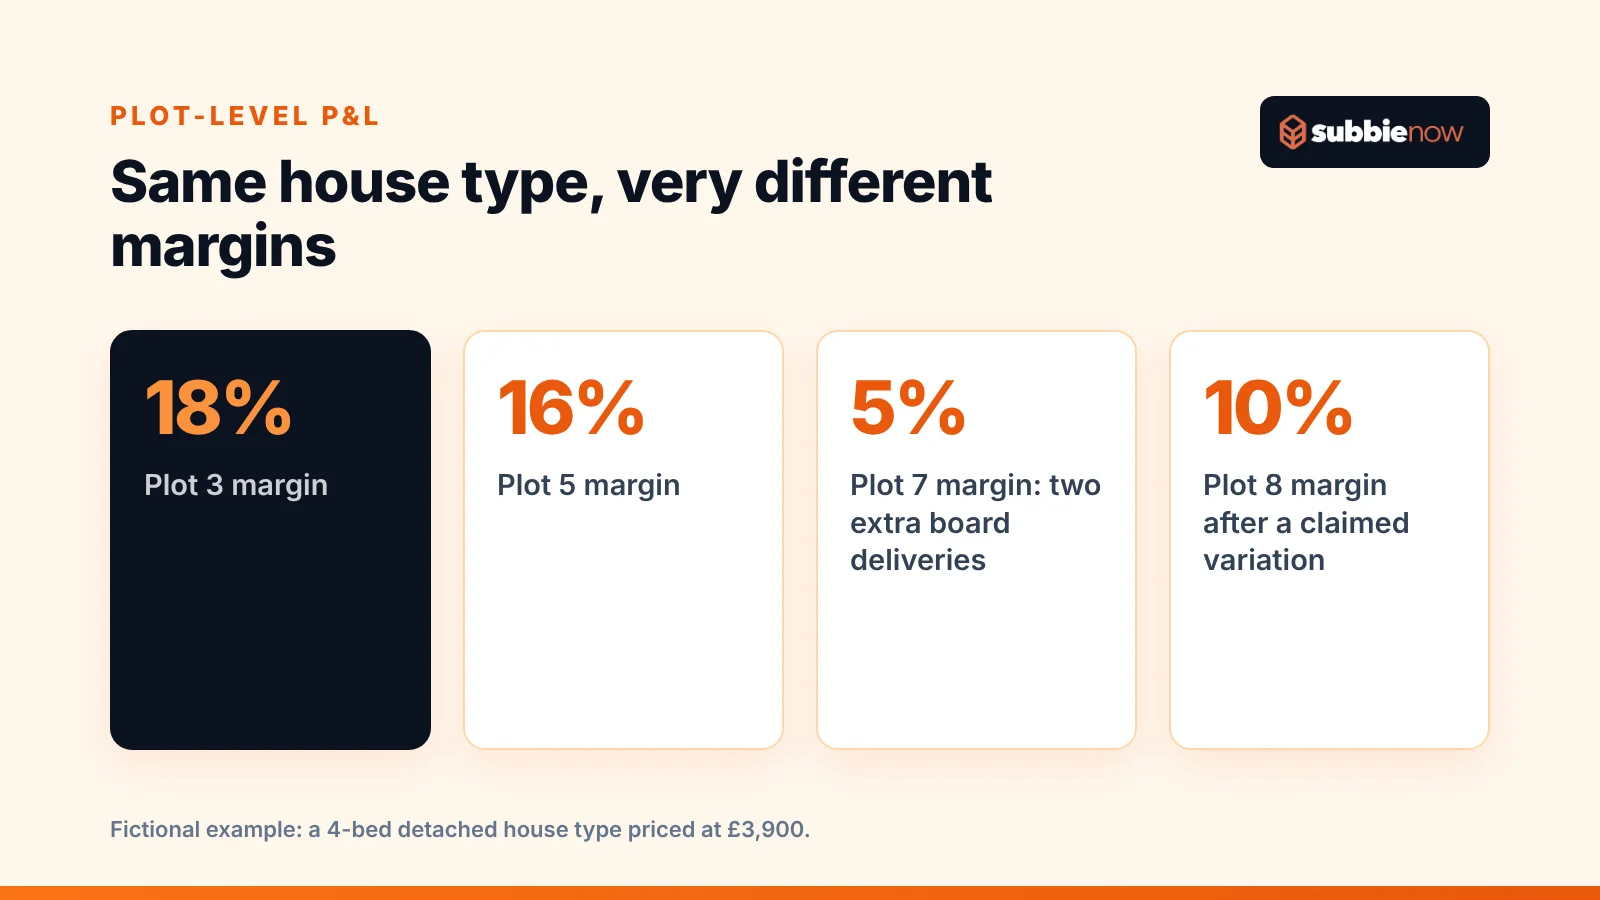
Fictional example. A plastering subcontractor prices a 4-bed detached house type at £3,900 for the full plaster package. By plot 8, the P&L shows:
| Plot | Sales | Total cost | Margin |
|---|---|---|---|
| 3 | £3,900 | £3,180 | 18% |
| 5 | £3,900 | £3,260 | 16% |
| 7 | £3,900 | £3,710 | 5% |
| 8 | £4,250 | £3,840 | 10% |
Plot 7 stands out. The materials line shows two extra board deliveries. A site report confirms boards were damaged by weather while stored on the plot. Plot 8 includes a £350 variation for extra boxing-in that was claimed, which is why its margin recovered. The fix (covered storage and a variation for the damaged boards caused by the programme change) is made with 40 plots still to go.
How do you set it up?
- Break your price down by house type and build stage, the same way the housebuilder values.
- Record labour against plots, not just against the site or the week.
- Order materials against plots and stages, so deliveries carry their plot.
- Log variations and sales extras on the plot they belong to.
- Review weekly, sorted by margin, and look for patterns.
Where SubbieNow fits
SubbieNow runs a full P&L report at site, plot or house-type level: base costs, current costs, variation costs, total costs and sales, across any combination of clients, sites and plots. Because operatives submit work and raise orders against plots from the app, the cost side fills itself in as the job runs.
Read more about the admin system, check pricing, or book a demo to see a P&L built from your own house types.
Frequently asked questions
Why isn't a monthly management P&L enough?
It shows the whole business after the month has ended. By then a loss on one house type or one gang is buried among profitable work, and the plots are finished.
What do I need to track to see profit per plot?
The plot's value (contract stages, variations, sales extras), the labour paid for work on it, and the materials and consumables delivered to it.
Should I track by plot or by house type?
Both. Plots show individual problems; house types show whether your price for a design is right across the site.