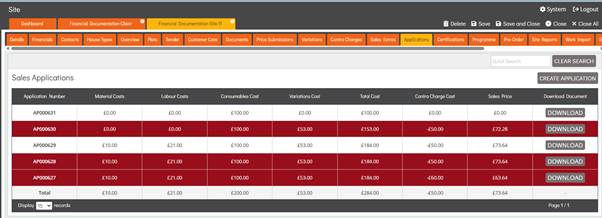
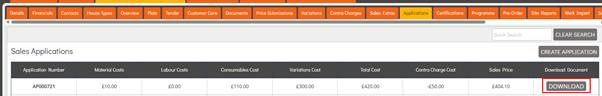
Sites Applications
The Applications area allows users to Create, Edit, and Delete Sales Applications for the selected Site.
A Sales Application is used to record and submit claims for payment based on work completed. Users can raise claims against:
When a Sales Application is created and values are entered against these items, it represents a request for payment for completed work.
This section contains a Quick Search feature which targets the Application Number column.
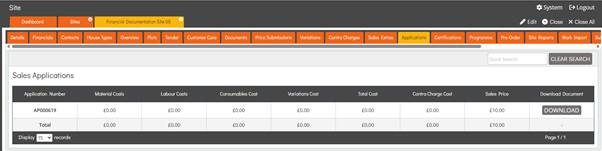
The Applications list displays a table with multiple columns, each showing key information for every Application associated with the selected Site.
The following sections describe each column in detail and explain the information presented.
- Application Number – Displays the Application Number for each Application in the list. This number is automatically generated by the system when an Application is created. Each Application is assigned a unique number for identification and tracking purposes.
- Material Costs – This figure represents the Total Material Cost for the Application. It includes only the Material Costs associated with Sales Application Build Stages that have been claimed within the Application.
- Labour Costs – This figure represents the Total Labour Cost for the Application. It includes only the Labour Costs associated with Sales Application Build Stages that have been claimed within the Application.
- Consumables Cost – This figure represents the Total Consumables Cost for the Application. It is calculated by including the Cost of any Consumable Orders that fall within the Application Date Range, which is defined on the Sales Application Details page. The relevant Consumable Orders are identified using their Requested For date.
- Variations Cost – This figure represents the Total Variations Cost for the Application.
- It includes both the Material and Labour Costs for each Quantity of a Sales Application Variation that has been claimed against.
- Total Cost – This figure represents the Total Cost for the Application. It combines the Material, Labour, Consumables, and Variation Costs to provide the overall Total Cost of the Application.
- Contra Charge Cost – This figure represents the Contra Charge Cost for the Application. It includes the amounts from Sales Application Contra Charges that have been claimed. These Costs are deducted from the Sales Price, as they represent Internal Costs rather than billable work.
- Sales Price – This figure represents the overall Sales Price for the Application. It is calculated by summing the Claimed Price for each Sales Application Build Stage, Sales Extra, and Variation, and then deducting the total of any claimed Sales Application Contra Charges.
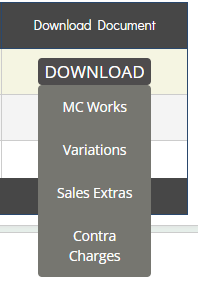
- Download Document – This column contains a Download button. When hovered over, it displays additional options for different exports of the Sales Application Document, which are MC Works, Variations, Sales Extras & Contra Charges.
Creating & Deleting Sales Applications
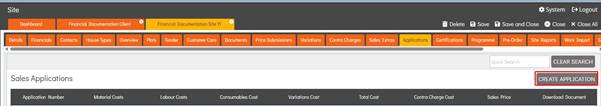
To create a new Application, the user can enter Edit mode and select the Create Application button located above the right-hand side of the table.
The system will navigate the user to a new Sales Application record, which opens automatically on the Sales Application Details page.
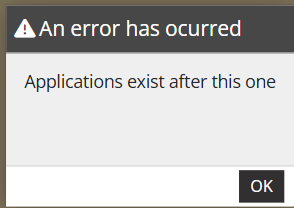
To delete an existing Application, the user can select the desired record from the list table, enter Edit mode, and then select the Delete button in the top right corner. Deletion is permanent and cannot be undone.
The system prevents deletion if there are subsequent Applications after the one being deleted. In this case, an error message will appear stating “Applications exist after this one“.
Deleted Application records are highlighted in red in the list table, making it easy for users to identify them.
Sales Application Details
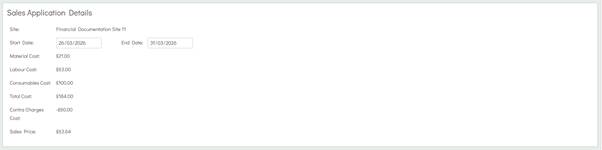
The Sales Application Details page allows users to set the Start Date and End Date for the Application. It also provides a view of the financials for the Application, including Costs and Sales Price.
Initially, the Start Date and End Date fields will be blank. Users can select any date for these fields.
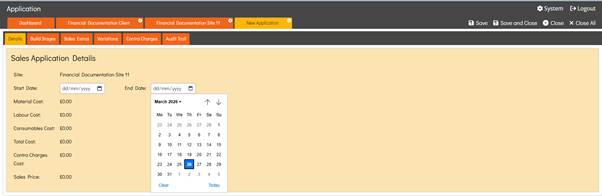
The date range determines which Consumable Orders are included in the Application. Only Consumable Orders with a Requested For date that falls within the Application date range will be included.
Once the Application has been saved with a date range, any Consumable Costs that fall within that range will be automatically pulled into the Application.
The Material Cost figure represents the Total Material Cost for the Application. It includes only the Material Costs associated with Sales Application Build Stages and Sales Application Variations that have been claimed within the Application.
The Labour Cost figure represents the Total Labour Cost for the Application. It includes only the Labour Costs associated with Sales Application Build Stages and Sales Application Variations that have been claimed within the Application.
The Total Cost figure represents the Total Cost for the Application. It combines the Material, Labour, Consumables, and Variation Costs to provide the overall Total Cost of the Application.
The Contra Charges Cost figure represents the Contra Charge Cost for the Application. It includes the amounts from Sales Application Contra Charges that have been claimed. These Costs are deducted from the Sales Price, as they represent Internal Costs rather than billable work.
The Sales Price figure represents the overall Sales Price for the Application. It is calculated by summing the Claimed Price for each Sales Application Build Stage, Sales Extra, and Variation, and then deducting the total of any claimed Sales Application Contra Charges.
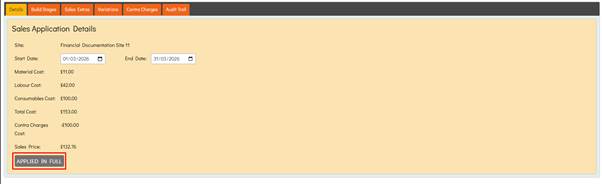
In Edit mode, a button named APPLIED IN FULL appears. When selected, the system will set all Sales Application Build Stages, Sales Extras, Variations, and Contra Charges to claim the maximum amount available for each item.
Sales Application Build Stages
The Sales Application Build Stages section allows users to view key information for claimable Build Stages and set the Claim In Application value for each stage.
The Build Stages section contains a Quick Search feature which targets the Plot Number column.
For a Build Stage to appear in the table, one of the following must have occurred:
- A Purchase Order has been made against it and been sent.
- A Work Submission has been submitted against it and been accepted.
- A Work Import has been performed, which imports a Cost for the Build Stage, indicating that the work has been completed and is now available to claim against.
If an Operative creates a Work Submission on the Operative Portal, its visibility within the Application is based on the created date of the Work Submission and the Date Range of the Application.
If a Work Submission is created on the Admin Site, its visibility within the Application is based on the submitted date of the Work Submission and the Date Range of the Application.
Sent Purchase Orders and Accepted Work Submissions do not make Build Stages appear in Applications that have already been created. They will only be applied to Applications created after those actions have taken place.
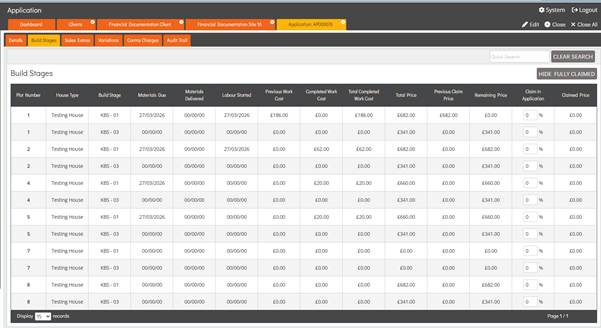
The list table contains multiple columns, each displaying key information for every claimable Build Stage. The columns are described in detail below.
- Plot Number – Displays the Plot Number for the Plot that the Build Stage is associated with.
- House Type – Displays the House Type that the Build Stage is associated with.
- Build Stage – Displays the name for the Build Stage.
- Materials Due – This date represents the Requested For date of the most recently sent Purchase Order for the Build Stage, providing it falls within the Application Date Range. This date will not be updated within an existing Application. To reflect an updated date, the user must create a new Application.
- Materials Delivered – This date represents when the Materials were delivered for those ordered against the Build Stage. If Materials that were due are marked as delivered, this date will be updated within the existing Application to reflect the delivery date.
- Labour Started – This date represents the earliest date that Labour Started for the Build Stage. This is determined by when a Work Submission was Accepted for the Build Stage.
- Previous Work Cost – This figure represents the cumulative Cost of previously completed work, including Purchase Orders and Work Submissions, but only for work that has been previously claimed, up to the last claim.
- Completed Work Cost – This figure represents the Costs of completed work, including Purchase Orders and Work Submissions. This value only includes work that has not yet been claimed in previous applications. Once this work has been claimed, it will appear in the Previously Claimed Cost column in future applications.
- Total Completed Work Cost – This figure represents the total value of work completed for the Build Stage, including all Costs from Purchase Orders and Work Submissions. It is calculated as the combined Cost of Previous Work Cost and Completed Work Cost.
- Total Price – This figure represents the total Sales Price for the Build Stage, based on the Sales Price from the most recently agreed Price Submission.
- Previous Claim Price – This is a cumulative value representing the amount that has been previously claimed for the Build Stage across all Applications on the Site. It is calculated by summing the Claimed Price for that Build Stage from all previous Applications.
- Remaining Price – This figure represents the amount left to claim in the Application for the Build Stage. It is calculated by subtracting the Previous Claim Price from the Total Price, resulting in the Remaining Price.
- Claim in Application – When the user enters Edit mode, this field becomes editable. The user can enter a numeric value up to 100, representing the percentage of the Remaining Price they are claiming in the Application. If the user navigates to a previous Application, they can still modify the Claim In Application percentage unless a more recent Application has already claimed against it. In that case, the field will be locked for the previous Application.
- Claimed Price – This figure represents the price being claimed within the Application the user is viewing, calculated by applying the Claim In Application percentage to the Remaining Price.
When the Hide Fully Claimed button is selected, all Build Stages with a Remaining Price of £0.00 will be hidden from the list table, so only Build Stages with a price left to claim are displayed.
The button will then change to Show Fully Claimed. If clicked again, it will revert to Hide Fully Claimed and display all Build Stages, including those that have been fully claimed.
When a Build Stage exists within an Application, it will appear in the Sales Application Document.
If a Build Stage has a Sales Parent within the System Build Stages area, all related information such as Materials Due, Materials Delivered, Labour Started, Costs, and Prices will be displayed under the Sales Parent Build Stage within the Application and Sales Application Document.
Within Application Settings, if the Build Stage in the Claim With dropdown is changed, the Build Stage for which the dropdown was altered will not appear in the Application until the selected Build Stage in the dropdown appears in the Application.
Also, within Application Settings, if the checkbox for a Build Stage is selected under a different Build Stage, then the Build Stage in the column will act as the Sales Parent for the Build Stage that has had the checkbox selected in that column.
When a Plot is marked as Complete on the Plot Details page, the Build Stages associated with that Plot will appear in future Applications and be available to claim against.
If a user performs a Sales Import for a Build Stage and then agrees to the Price Submission that is automatically created by the system when the Sales Import is performed, the Total Price for that Build Stage in future Applications will reflect the imported price.
If a user performs a Work Import for a Build Stage, the Completed Work Cost and Total Completed Work Cost figures in future Applications will reflect the imported cost. The Build Stage will appear in the Application without any Purchase Orders or Work Submissions being made against it, because the Work Import indicates that the work has been completed and is available to claim.
When the Build Stage is claimed against, future Applications will transfer the imported cost from the Completed Work Cost column to the Previously Claimed Cost column.
If a Work Import is reverted, the Build Stage will no longer appear in the Application until a Purchase Order is sent or a Work Submission is accepted against it. In that case, the Completed Work Cost will display the actual cost of the work completed rather than the imported cost.
Build Stages that have been fully claimed, will still appear in future Applications, they will just have a Remaining Price of £0.00.
Sales Application Sales Extras
The Sales Application Sales Extras section allows users to view key information for claimable Sales Extras and set the Claim In Application value for each Sales Extra.
When a Sales Extra is created for the Site, it will appear in the Sales Extras section within all existing Applications for that Site.
The Sales Extras section contains a Quick Search feature which targets the Name column.
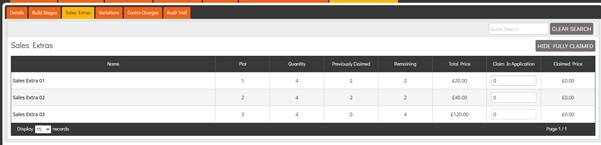
The list table contains multiple columns, each displaying key information for every claimable Sales Extra. The columns are described in detail below.
- Name – Displays the Name for each Sales Extra, which is the option selected in the Sale Extra dropdown within the Site Sales Extras Details page.
- Plot – Displays the Plot that the Sales Extra is assigned to, identified by its Plot Number.
- Quantity – Displays the Quantity for each Sales Extra. The Quantity is taken from the Quantity field on the Site Sales Extras Details page.
- Total Price – This column represents the Total Price for each Sales Extra. It is calculated by multiplying the Sales Extra Quantity by the Unit Price of the Sales Extra, as set in the Client’s Sales Extra section.
- Claim In Application – When the user enters Edit mode, this field becomes editable. The user can enter a numeric value to specify how many of that Sales Extra will be claimed in the Application. The system will not allow the user to exceed the Sales Extra Quantity; if an attempt is made, the value will automatically be reduced to the maximum allowed Quantity. When this field is populated, it will update the Claimed Price column.
- Claimed Price – The Claimed Price is calculated based on the amount of the Sales Extra being claimed in the Application. This value is updated automatically whenever the Claim In Application Quantity is altered.
If a Sales Extra has been fully claimed, it will no longer appear in futureApplications.
When a Sales Extra exists within an Application, it will appear in the Sales Application Document.
Sales Application Variations
The Sales Application Variations section allows users to view key information for claimable Variations and set the Claim In Application value for each Variation.
When a Variation is created for a Site and becomes Client Approved, it will appear in the Variation section of any Applications created after the point at which it is Client Approved.
The Variation section contains a Quick Search feature which targets the Reference Number column.
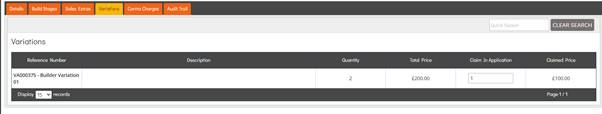
The list table contains multiple columns, each displaying key information for every claimable Variation. The columns are described in detail below.
- Reference Number – Displays the Reference Number & Name for each Variation.
- Description – Displays the Description for each Variation, which is entered in the Variation Details page.
- Quantity – Displays the Quantity for each Variation, which is entered in the Variation Details page.
- Total Price – Displays the Total Price for each Variation, which is derived from the Rate field within the Variation Details page.
- Claim In Application – When the user enters Edit mode, this field becomes editable. The user can enter a numeric value to specify the Quantity being claimed in the Application.The user cannot exceed the Quantity set for the Variation; if a higher value is entered, the system will automatically reduce it to the maximum allowed Quantity. When the Claim In Application value is changed, the Claimed Price figure will be updated accordingly.
- Claimed Price – The Claimed Price is calculated based on the amount of the Variation being claimed in the Application. This value is updated automatically whenever the Claim In Application Quantity is altered. The Claimed Price per unit of a Variation is calculated by dividing the Total Price by the maximum Quantity for that Variation, determining the price of a single unit.
If a Variation has been fully claimed, it will no longer appear in futureApplications.
When a Variation exists within an Application, it will appear in the Sales Application Document.
Sales Application Contra Charges
The Sales Application Contra Charges section allows users to view key information for claimable Contra Charges and set the Claim In Application value for each Contra Charge.
When a Contra Charge is created and approved, it will appear in future Applications for the Site.
The Contra Charge section contains a Quick Search feature which targets the Name column.
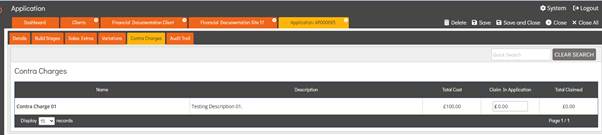
The list table contains multiple columns, each displaying key information for every claimable Contra Charge. The columns are described in detail below.
- Name – Displays the Name for each Contra Charge, which is entered in the Contra Charge Details page.
- Description – Displays the Description for each Contra Charge, which is entered in the Contra Charge Details page.
- Total Cost – This figure represents the Total Cost for each Contra Charge. It is based on the Rate set in the Contra Charge Details page.
- Claim In Application – When the user enters Edit mode, this field becomes editable. The user can enter a numeric value representing the amount to be deducted from the Sales Price for the Application. The user cannot exceed the Total Cost; if a higher value is entered, the system will automatically adjust it to match the Total Cost.
- Total Claimed – This figure represents the amount that has been claimed to date for the Contra Charge within the Application.
Once a Contra Charge has been claimed in the Application, it will appear as a deduction in the Operative’s Additions & Deductions popup & Payslip Email.
When a Contra Charge exists within an Application, it will appear in the Sales Application Document.
Downloading Sales Application Documents
The Sales Application Document provides a comprehensive view of the financial status of a Site. It includes details of amounts claimed in the current Application, as well as those claimed in previous Applications.
Users can download the Sales Application Document from the Applications list page by selecting the Download button in the Download Document column for the relevant Application.
The system will trigger the download of the full document, which includes all available tabs. If only a specific section of the document is required, the user can hover over the Download button to display additional options, including MC Works, Variations, Sales Extras, and Contra Charges. Selecting one of these options will initiate a download of the Sales Application Document containing only the sub-tab related to the chosen section, rather than the full document.
The document is structured into multiple tabs, including a Summary tab that provides an overall view of the Application, as well as individual tabs representing specific items that may be included in an Application.
Sales Application Document Summary
The Application Summary screen provides a consolidated financial view of the selected Application. It displays key contract details, application data, financial breakdowns by work category, Certification status, and overall totals including Retention, Application Value, and Amounts Due.
Summary Header Details:
At the top of the Summary tab, the Application Document displays key information about the application. Each field is described below.
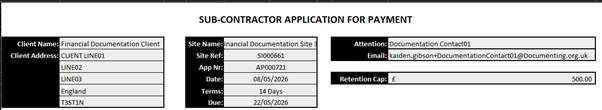
- Client Name – Displays the name of the Client associated with the Application.
- Client Address – Displays the address of the Client associated with the Application. This address is entered and maintained on the Client Details page.
- Site Name – Displays the name of the Site associated with the Application.
- Site Ref – Displays the Site Reference Number for the associated Site. This reference is automatically generated by the system when the Site is created.
- App Nr – Displays the Application Number associated with the Sales Application Document. This number is automatically generated by the system when the Application is created.
- Date – Represents the End Date of the Application associated with the Sales Application Document. This date is entered and maintained on the Sales Application Details page.
- Terms – Displays the Payment Terms for the Site. These are entered and maintained on the Site’s Financials page and may be defined in Days, Weeks, Months, or Years.
- Due – Displays the Due Date for the Application. This is calculated by taking the Application End Date and adding the Payment Terms, resulting in the final Due Date.
- Attention – Displays the name of the Site’s Primary Contact. This contact is selected on the Site Details page.
- Email – Displays the Email Address of the Site’s Primary Contact. This is entered and maintained in the Client Contacts area.
- Retention Cap – Represents the Retention Cap set for the Site associated with the Sales Application Document. This value is entered and maintained on the Site’s Financials page and defines the maximum amount of Retention that can be automatically deducted from Applications on the Site. When the limit is reached, the system will no longer automatically apply Retention to subsequent applications.
Financial Breakdown:
This table provides a breakdown of financial values across different items in the Application. It includes Main Contract Works, Site Instructions/Variations, Sales Variation Orders, and Contra Charges. These values contribute to the overall calculation of Gross Value, Net Value, Retention, and Total Net Value for the Application.
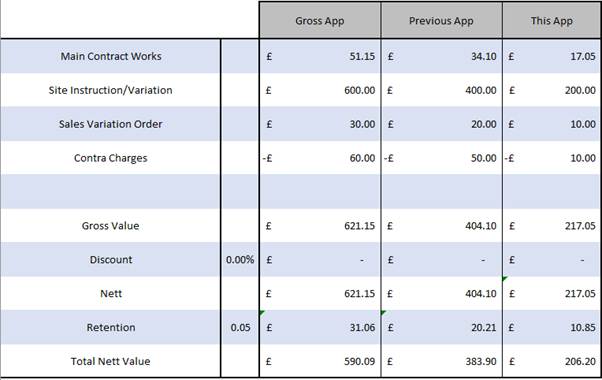
The Gross App value represents the combined total of all previous Applications together with the value of the current Application.
The Previous App value represents the total of all previous Applications.
The This App value represents the value of the current Application.
The table contains multiple fixed rows, which represent each different item within the Application along with other key financial information. Each row is described below.
- Main Contract Works – The Main Contract Works row represents the value of any Sales Application Build Stages that have been claimed against.
- Site Instruction/Variations – The Site Instruction/Variation row represents the value of any Sales Application Variations that have been claimed against.
- Sales Variation Order – The Sales Variation Order row represents the value of any Sales Application Sales Extras that have been claimed against.
- Contra Charges – The Contra Charges row represents the value of any Sales Application Contra Charges that have been claimed against. Contra Charges that have been claimed against are always displayed as a negative value in the Sales Application Document. This is because a Contra Charge represents an internal cost that is not charged to the Client. As a result, it is shown as a negative value so that it is deducted from the Application Amount Due.
- Gross Value – The Gross Value row represents the combined value of all Main Contract Works, Site Instructions/Variations, Sales Variation Orders, and Contra Charges.
- Nett – The Nett Value row represents the combined value of all Main Contract Works, Site Instructions/Variations, Sales Variation Orders, and Contra Charges.
- Retention – The Retention row displays the Retention percentage applied to the Application. This percentage is set and maintained on the Site’s Financials page. The values shown represent the amount of Retention deducted from the Application Amount, calculated by multiplying the Retention percentage by the Gross Value.
- Total Nett Value – The Total Nett Value row represents the Nett value of the Application after the Retention amount has been deducted, resulting in the Total Net Value.
Certification Summary:
This section shows Certification progress, including amounts Certified to Date and Outstanding from Previous Applications. It provides visibility of what has already been Certified against what is still pending.
The Certification Summary table contains two columns. Each column is described below.
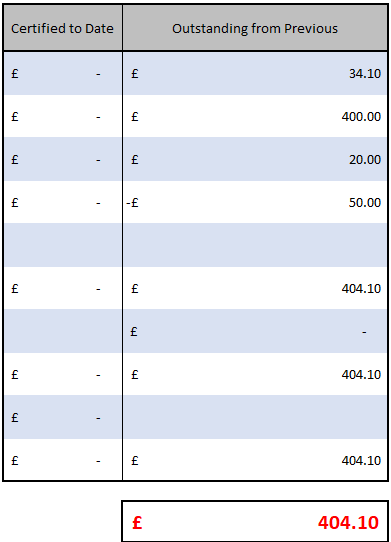
The Certified to Date column represents the total amount that has been certified within Certifications on the Site.
Certification for each application item is carried out in the following sections:
- Main Contract Works – Main Contract Works certification is set in the Certification Build Stages section.
- Site Instruction/Variation – Site Instruction/Variation certification is set in the Certification Variations section.
- Sales Variation Order – Sales Variation Order certification is set in the Certification Sales Extras section.
- Contra Charges – Contra Charges certification is set in the Certification Contra Charges section.
- Retention – Retention certification is set on the Certification Details page in the Retention Taken field.
The Certified to Date value for Total Nett Value represents the combined total of all Certified to Date figures, less the Certified to Date Retention amount.
The Outstanding from Previous column represents the amount remaining to be certified from previous Applications on the Site.
The figure shown in red below the Certification Summary table represents the combined total of the Outstanding from Previous amounts for Main Contract Works, Site Instruction/Variation, Sales Variation Order, and Contra Charges. This highlights the total value remaining to be claimed from previous Applications.
Application Totals:
This section summarises the final calculated figures for the Application, including the Application Amount and Total Due, which represent the amount payable based on the current Application values.
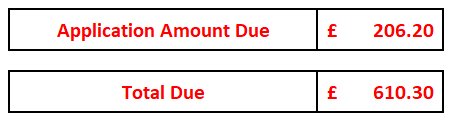
The Application Amount Due figure represents the Total Nett Value being claimed in the current Application.
The Total Due figure represents the combined value of the Application Amount Due and the Total Outstanding from Previous figures.
Anticipated Forecast:
This section provides a forecasted financial summary of the Site, including Main Contract, Variations, Sales Extras, Contra Charges, and Discount. It also shows Sub Total, Claimed to Date, and Cost to Complete.
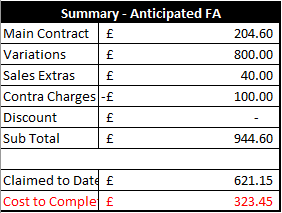
Each row within the Summary – Anticipated FA table is described in detail below, providing a breakdown of the values shown and how they are calculated or derived.
- Main Contract – The Main Contract figure represents the combined total price of all Build Stages included within the Sales Application Document MC Works tab.
- Variations – The Variations figure represents the combined total value of all Variations included within the Sales Application Document Variations tab.
- Sales Extras – The Sales Extras figure represents the combined total value of all Sales Extras included within the Sales Application Document Sales Upgrades tab.
- Contra Charges – The Contra Charges figure represents the combined total value of all Contra Charges included within the Sales Application Document Contra Charges tab. Contra Charges always displayed as a negative value in the Sales Application Document. This is because a Contra Charge represents an internal cost that is not charged to the Client. As a result, it is shown as a negative value so that it is deducted from the Sub Total.
- Sub Total – The Sub Total figure represents the combined total of all Main Contract, Variations, Sales Extras, and Contra Charges values within the Summary – Anticipated FA table.
- Claimed to Date – The Claimed to Date figure represents the Gross Value that has been Claimed to Date, including both previous Applications and the current Application.
- Cost to Complete – The Cost to Complete figure represents the difference between the Sub Total and the Claimed to Date figure, indicating the remaining value required to complete the works.
Sales Application Document MC Works
The Sales Application Document MC Works tab provides a detailed breakdown of claim values for each Plot Build Stage, including their Tender Prices, Applied Amounts, and Certification status. It consolidates financial data across Build Stages, Applications, and Certified values to present a full view of claim progression and outstanding balances.
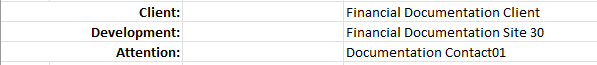
The top of the MC Works sheet displays the Client, Development, and Attention contact associated with the Application.
The Client section displays the Client associated with the Application. The Development section displays the Site associated with the Application. The Attention field displays the Primary Contact for the associated Site, which is set and maintained on the Site Details page.
Plot Build Stage Breakdown:
This section provides a financial breakdown of claim values across all non-deleted Plot Build Stages. Each Build Stage includes the following components:
- Plot – Displays the non-deleted Plots for the Site, shown by their Plot Numbers.
- Housetype – Displays the House Type associated with each Plot, shown by its Display Name.
- Spec – Displays the Specification associated with each Plot.
- Claimed – The percentage shown in this column represents the overall amount of the Plot Build Stage that has been Claimed to Date within the Site’s Applications.
- Applied This Period – The Applied This Period percentage represents the proportion of the total Build Stage value that has been claimed within the current Sales Application, considering the cumulative percentage already claimed against the Build Stage in previous Applications.
- Tender Price – Displays the Sales Price for each Plot Build Stage. This is the price marked as agreed within the latest agreed Price Submission.
- Total Claim – Displays the amount of the Sales Price that has been claimed to date, including both previous Applications and the current Application.
If a Plot Build Stage is assigned a Sales Parent within the System Build Stages area, the child Build Stage is grouped under the Sales Parent in the MC Works tab of the Sales Application Document. As a result, the child stage is not displayed separately, as its value is included within the Sales Parent.
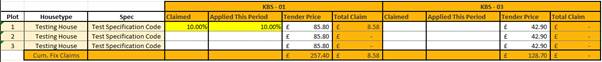
Within the MC Works tab, Build Stage Claimed & Applied This Period cells are highlighted in yellow within the download when the user has made a claim against that Build Stage in the Sales Application Build Stages section. If the user has not made a claim against a Build Stage in the Application, the cell is not highlighted within the download.
Once a Build Stage has been claimed to 100%, the Build Stage is considered fully claimed and will be greyed out in subsequent Sales Application documents to indicate that no further claims can be made against it. The Build Stage is not greyed out within the Sales Application document where it was initially claimed to 100% and will only appear greyed out in the following Applications.
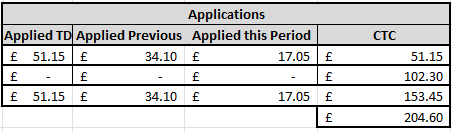
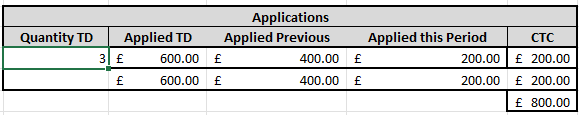
Applications Summary:
This section provides a summary of claim progression throughout the Application process. It includes:
- Applied TD – The Applied TD figure represents the total amount that has been claimed to date for the Plot.
- Applied Previous – The Applied Previous figure represents the total amount that has been claimed for the Plot in previous Applications, excluding any amounts claimed in the current Application.
- Applied this Period – The Applied This Period figure represents the amount that has been claimed for the Plot in the current Application period only.
- CTC – The CTC figure represents the cost to complete the Plot. This is calculated by taking the combined total of all Tender Prices for the Plot Build Stages and subtracting the Applied TD figure, resulting in the remaining cost to complete.
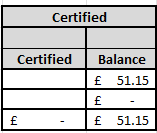
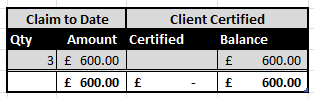
Certification Summary:
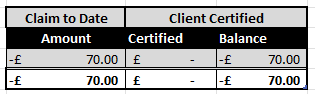
This section provides an overview of the certification status for all claimed amounts. It is used to clearly indicate how much of the claimed value has been certified and how much remains outstanding. It shows:
- Certified – The Certified figure represents the portion of the claimed amount that has been certified within a Certification for the Site.
- Balance – The Balance figure represents the portion of the claimed amount that is still outstanding and has not yet been certified within a Certification for the Site.
Sales Application Document Variations
The Variations tab within the Sales Application Document provides a detailed record of all Variations included in the Sales Application Variations section for the downloaded Application. It also displays the associated financial values, application status, and certification progress for each variation.
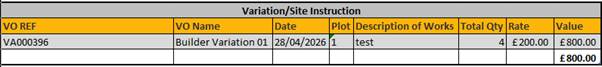
Variations Breakdown:
This section provides a summary of the key details relating to each Variation. It presents an overview of the Variations and their associated financial information. Each column is explained below.
- VO REF – Displays the Variation Reference Number for each Variation. This is automatically generated by the system when the Variation is marked as internally approved.
- VO Name – Displays the Variation Name for each Variation. This is entered and maintained on the Variation Details page.
- Date – Displays the Created Date for each Variation.
- Plot – Displays the Plot that the Variation is associated with, displayed by their Plot Number, the Plot for a Variation is selected in the Variation Details page.
- Description of Works – Displays the description for each Variation. This is entered in the Description field on the Variation Details page.
- Total Qty – Displays the Variation Quantity for each Variation,
- Rate – Displays the Rate for each Variation. This is entered in the Rate field on the Variation Details page.
- Value – Displays the Value for each Variation. This is calculated by applying the Rate to the Total Quantity for the Variation, resulting in the final Value.
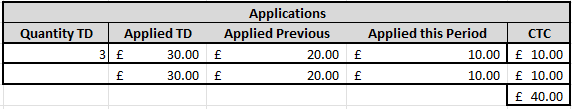
Application Summary:
This section provides a summary of how Variation claimed values progress through Applications, showing how amounts are applied and carried forward over time. It gives an overview of both current and previous Application activity, as well as any remaining values yet to be claimed. Each element is explained below.
- Quantity TD – Displays the Quantity that has been claimed to date, including both previous Applications and the current Application.
- Applied TD – Displays the amount that has been claimed to date across both previous and current Applications. This is calculated by taking the Quantity TD and applying the relevant Rate to determine the Applied TD value.
- Applied Previous – Displays the amount that has been claimed in previous Applications only, excluding any amounts applied in the current Application.
- Applied this Period – Displays the amount that has been applied in the current Application period only.
- CTC – Displays the cost to complete (CTC) for each Variation. This is calculated by taking the total Value of the variation and subtracting the Applied TD value, representing the remaining value yet to be applied.
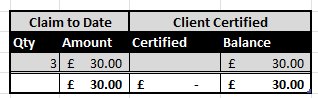
Certification Summary:
This section shows the Certification status of the Variation values. It includes the total certified quantity and amount, along with any outstanding balance that remains uncertified. This provides visibility of approved versus pending Variation values from a Client Certification perspective. Each column is explained below.
- Claim to Date
- Qty – The Claimed to Date Qty represents the quantity of the Variation that has been claimed across both previous Applications and the current Application.
- Amount – The Claimed to Date Amount represents the total value of the Variation that has been claimed across both previous Applications and the current Application.
- Client Certified
- Certified – The Client Certified value represents the portion of the applied amount that has been certified within a Certification for the Site.
- Balance – The Balance represents the portion of the applied amount that remains outstanding and has yet to be certified within a Certification.
Sales Application Document Sales Upgrades
This section provides a consolidated view of Sales Extra items and their associated financial progression through Applications and Certification. It brings together key details such as the value of each Sales Extra, how it has been applied across current and previous Applications, and the remaining cost to complete. It also shows how much of the applied value has been certified by the Client and what balance remains outstanding.
Sales Extra Breakdown:
The Sales Extra Breakdown table provides a summary of the Sales Extras, showing their Quantities, Rates, and resulting Values. Each column is described below.
- Sales Ref – The Sales Ref column displays the sales reference number for each Sales Extra. This is automatically generated by the system when the Sales Extra is created.
- REF – The Sales Ref column displays the sales reference number for each Sales Extra. This is automatically generated by the system when the Sales Extra is created.
- Date – The Date column displays the Created Date for each Sales Extra.
- Plot – The Plot column displays the Plot associated with each Sales Extra, shown by its Plot Number. The Plot is selected from the Plot dropdown on the Site Sales Extra Details page.
- Description of Extra – The Description of Extra column displays the name of the Sales Extra. This is derived from the Sales Extra field on the Site Sales Extra Details page.
- Location – The Location column displays the Location associated with each Sales Extra. This is derived from the Location field on the Site Sales Extra Details page.
- Total Qty – The Total Qty column displays the total quantity for each Sales Extra. This is derived from the Quantity field on the Site Sales Extra Details page.
- Rate – The Rate column displays the Rate for each Sales Extra. This is set and maintained in the Client Sales Extras section.
- Value – The Value column displays the total Value for each Sales Extra. This is calculated by applying the Total Qty to the Rate, resulting in the final Value.

Application Summary:
This section provides a summary of how Sales Extras claimed values progress through Applications, showing how amounts are applied and carried forward over time. It gives an overview of both current and previous Application activity, as well as any remaining values yet to be claimed. Each element is explained below.
- Quantity TD – Displays the Quantity that has been claimed to date, including both previous Applications and the current Application.
- Applied TD – Displays the amount that has been claimed to date across both previous and current Applications. This is calculated by taking the Quantity TD and applying the relevant Rate to determine the Applied TD value.
- Applied Previous – Displays the amount that has been claimed in previous Applications only, excluding any amounts applied in the current Application.
- Applied this Period – Displays the amount that has been applied in the current Application period only.
- CTC – Displays the cost to complete (CTC) for each Sales Extra. This is calculated by taking the total Value of the Sales Extra and subtracting the Applied TD value, representing the remaining value yet to be applied.
Certification Summary:
This section shows the Certification status of the Sales Extra applied values. It includes the total certified quantity and amount, along with any outstanding balance that remains uncertified. This provides visibility of approved versus pending Sales Extra values from a Client Certification perspective. Each column is explained below.
- Claim to Date
- Qty – The Claimed to Date Qty represents the quantity of the Sales Extra that has been claimed across both previous Applications and the current Application.
- Amount – The Claimed to Date Amount represents the total value of the Sales Extra that has been claimed across both previous Applications and the current Application.
- Client Certified
- Certified – The Client Certified value represents the portion of the applied amount that has been certified within a Certification for the Site.
- Balance – The Balance represents the portion of the applied amount that remains outstanding and has yet to be certified within a Certification.
Sales Application Document Contra Charges
This section provides a consolidated view of Contra Charges and their associated financial progression through Applications and Certification. It brings together key details such as the value of each Contra Charge, how it has been applied across current and previous Applications, and the remaining cost to complete. It also shows how much of the applied value has been certified by the Client and what balance remains outstanding.
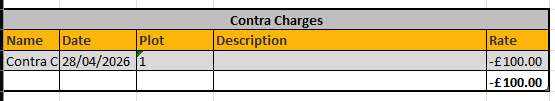
Contra Charges Breakdown:
The Contra Charges Breakdown table provides a summary of the Contra Charges, showing their Descriptions and Rates. Each column is described below.
- Name – Displays the Name of each Contra Charge. This is entered in the Name field on the Contra Charge Details page.
- Date – Displays the Created Date for each Contra Charge.
- Plot – Displays the Plot associated with each Contra Charge, shown by their Plot Number. The Plot is selected from the Plot dropdown on the Contra Charge Details page.
- Description – Displays the Description for each Contra Charge. This is derived from the Description field on the Contra Charge Details page.
- Rate – Displays the Rate for each Contra Charge. This is derived from the Rate field on the Contra Charge Details page and represents the value that is claimed against within the Application.
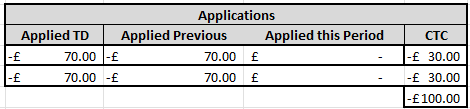
Application Summary:
This section provides a summary of how Contra Charges claimed values progress through Applications, showing how amounts are applied and carried forward over time. It gives an overview of both current and previous Application activity, as well as any remaining values yet to be claimed. Each element is explained below.
- Applied TD – Displays the amount that has been claimed to date across both previous and current Applications. This represents the total value claimed in the Sales Application Contra Charges tab.
- Applied Previous – Displays the amount that has been claimed in previous Applications only, excluding any amounts applied in the current Application.
- Applied this Period – Displays the amount that has been applied in the current Application period only.
- CTC – Displays the cost to complete (CTC) for each Contra Charge. This is calculated by taking the total Rate of the Contra Charge and subtracting the Applied TD value, representing the remaining value yet to be applied.
Certification Summary:
This section shows the Certification status of the Contra Charges applied values. It includes the total certified amount, along with any outstanding balance that remains uncertified. This provides visibility of approved versus pending Contra Charges values from a Client Certification perspective. Each column is explained below.
- Claim to Date
- Amount – The Claimed to Date Amount represents the total value of the Contra Charge that has been claimed across both previous Applications and the current Application.
- Client Certified
- Certified – The Client Certified value represents the portion of the applied amount that has been certified within a Certification for the Site.
- Balance – The Balance represents the portion of the applied amount that remains outstanding and has yet to be certified within a Certification.